
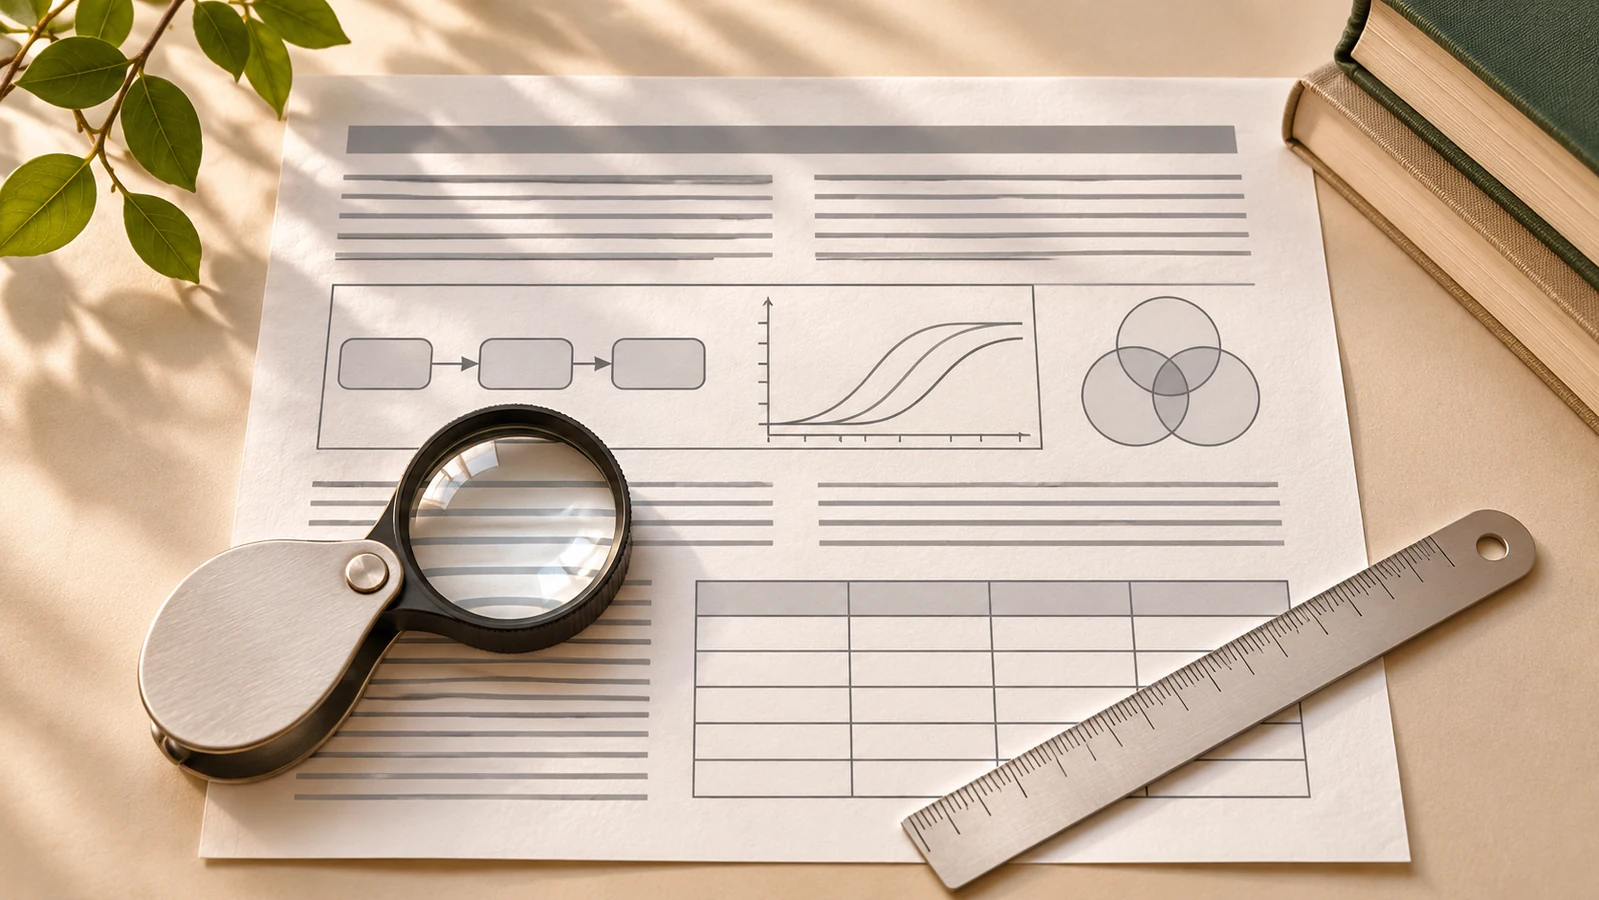
Introduction: When the Text Is Correct but the Evidence Is Not
A scientific manuscript can be carefully written, thoroughly edited, and supported by a detailed reference list—and still contain a serious publication error. A figure may have an incorrect label. A table may report a value that differs from the results described in the text. An image may lose resolution during conversion, or a legend may fail to explain the information needed to interpret the data.
These problems are easy to underestimate because figures and tables are sometimes treated as supporting elements rather than essential parts of a scientific article. In reality, they often communicate the study’s most important findings. Readers may examine a chart before reading the full article, compare numerical results in a table, or use a figure to understand an experimental method.
For editors, publishers, and production teams, this creates a clear responsibility: visual and tabular content needs quality control that goes beyond ordinary proofreading.
Scientific figures and tables are not merely illustrations. They are part of the research evidence, and their accuracy must be protected throughout the publishing process.
A dedicated quality-control workflow can help publishers identify errors, preserve the meaning of research findings, and deliver reliable content across print and digital formats.
On This Page
Why Figures and Tables Require Specialized Attention
Text and visual content present different types of quality risks. A spelling mistake in a paragraph may be visible during routine copyediting, while an incorrect axis scale, a missing unit, or an inconsistent table value may require technical knowledge to detect.
Figures can include photographs, graphs, diagrams, microscopy images, maps, flowcharts, and composite panels. Tables may contain experimental results, statistical summaries, participant characteristics, reference data, or complex comparisons.
Each format introduces its own requirements. A graph needs meaningful axes, labels, scales, and legends. A photograph may need adequate resolution, accurate identification, and appropriate disclosure of image processing. A table needs consistent headings, units, abbreviations, footnotes, and relationships between values.
These elements can also change during production. Images may be resized, fonts may become difficult to read, symbols may be substituted, and content may shift when a manuscript is converted into XML, HTML, PDF, or another format.
A dedicated process helps catch these issues before they affect the published article.
The Most Common Quality Problems in Scientific Figures
1. Incorrect or Inconsistent Labels
Labels identify what a figure represents. An incorrect variable name, swapped legend entry, missing unit, or mislabeled axis can change how readers interpret the results.
For example, a graph may show measurements from two experimental groups, but the legend may assign the colors to the wrong groups. The graphic could appear professionally designed while communicating the opposite of the intended comparison.
Quality control should check that every axis, legend, symbol, panel label, and annotation matches the manuscript and the underlying approved data or author-supplied information.
2. Low Resolution and Poor Readability
Scientific figures often contain fine details, small text, thin lines, and complex symbols. When images are compressed or enlarged improperly, these elements may become unreadable.
Resolution requirements depend on the image type, journal specifications, intended display size, and production format. A photograph and a line drawing may require different technical treatment.
Production teams should check image dimensions, resolution, file format, font legibility, line thickness, and contrast at the size at which the figure will actually appear. Merely confirming that an image file opens successfully is not enough.
3. Missing Units, Scales, or Context
A graph without clearly defined units or an image without an appropriate scale bar can make interpretation difficult or misleading.
Similarly, a chart that omits relevant information about the sample, measurement, or experimental conditions may not provide sufficient context for readers to understand the result.
Editors should check whether the figure includes the information required to interpret it and whether the caption explains relevant symbols, abbreviations, error bars, and statistical markers.
Not every figure requires the same level of detail, but essential context should not be left to guesswork.
4. Problems With Image Integrity
In some research fields, figures contain images derived from experiments, instruments, scans, or other scientific observations. These materials may require closer scrutiny for duplication, inappropriate manipulation, inconsistent processing, or missing disclosures.
Image-screening software can help identify patterns that deserve review, but a flagged image is not automatically evidence of misconduct. Similar structures can occur naturally, and some image adjustments may be acceptable when permitted by the journal and appropriately disclosed.
When a concern arises, editors may need the original image files, an explanation of the processing performed, or specialist assessment before reaching a conclusion.
The Most Common Quality Problems in Scientific Tables
Numerical Inconsistencies
Tables often contain multiple rows, columns, subgroups, percentages, averages, and statistical results. A single incorrect value can create confusion or contradict the findings reported in the main text.
For example, a percentage may not correspond to its stated numerator and denominator, or a table may contain a sample size that differs from the methods section.
Automated checks can help identify arithmetic inconsistencies, missing values, duplicate entries, or discrepancies between selected table cells and manuscript text. However, the correct value cannot always be determined from the table alone. The underlying data or confirmation from the authors may be required.
Missing Units and Ambiguous Headings
A column labeled “Concentration” may be insufficient if the measurement unit is not specified. Similarly, abbreviations may be familiar to specialists but unclear to readers from adjacent fields.
Quality control should verify that headings accurately describe the values, units are presented consistently, abbreviations are defined, and footnotes explain necessary qualifications.
This is particularly important when tables compare measurements obtained through different methods or under different experimental conditions.
Formatting That Changes Meaning
Formatting is not merely decorative in scientific tables. Indentation may indicate a subgroup, superscript letters may identify statistical differences, and symbols may distinguish categories or conditions.
If these elements are lost during typesetting or conversion, the table’s meaning can change.
Production checks should confirm that the table’s hierarchy, footnotes, symbols, alignment, and groupings remain intact across the final publication formats.
Building a Dedicated Figure and Table Quality-Control Workflow
Step 1: Create a Complete Asset Inventory
At submission, record all figures, tables, captions, supplementary items, and associated files. Assign each item a clear identifier and confirm that the files referenced in the manuscript are available.
Check that figure numbering and table numbering follow the journal’s requirements and that each item is cited in the appropriate location in the text.
This inventory reduces the risk of missing files, duplicated assets, and confusion between revised and earlier versions.
Step 2: Verify the Scientific Content Against the Manuscript
Compare figure labels, table headings, sample sizes, numerical values, units, and terminology with the corresponding information in the manuscript.
Where data are available in a structured format, automated comparisons may help identify inconsistencies. Statistical results and scientific interpretations may still require expert assessment.
Editors should avoid silently changing scientific values based on assumptions. If the correct information is unclear, request clarification from the authors.
Step 3: Conduct Technical File Checks
Verify that files meet the journal’s technical specifications. Relevant checks may include file format, image dimensions, resolution, color requirements, embedded fonts, transparency, and readability.
For complex or composite figures, check that panels are arranged correctly, labels are consistent, and no essential elements have been clipped or obscured.
The requirements should be appropriate to the intended output. A figure that looks clear on a large monitor may become difficult to read when reduced to a journal’s column width.
Step 4: Review Captions, Legends, and Footnotes
Captions and legends explain how visual content should be interpreted. They should define relevant abbreviations, symbols, experimental groups, error bars, scale bars, and statistical notation as required.
Check that captions correspond to the correct figure and that table footnotes are attached to the appropriate entries.
A well-prepared figure can still be confusing if its caption is incomplete or describes a different version of the graphic.
Step 5: Apply Risk-Based Scientific Review
Not every asset requires the same level of scrutiny. A simple conceptual diagram may need primarily technical and editorial checks, while a figure presenting central experimental findings may require closer scientific review.
Additional attention may be appropriate for clinical results, complex statistical plots, microscopy images, safety-related findings, or figures with unusual similarities to other published material.
A risk-based approach helps teams use specialist time effectively without delaying every manuscript unnecessarily.
Step 6: Recheck Figures and Tables After Typesetting
Quality control must continue after the content enters production. Text extraction, image conversion, resizing, and layout changes can introduce errors that were not present in the original submission.
Review the actual publication proofs. Confirm that labels remain readable, symbols render correctly, tables are complete, captions match their assets, and numerical values have not changed unexpectedly.
If the article will appear in multiple formats, check the relevant outputs rather than assuming that a correct PDF guarantees a correct HTML or XML version.
Step 7: Record Corrections and Approval
Maintain a record of significant corrections, author clarifications, and final approval status. This helps prevent previously corrected errors from reappearing when files are updated.
The process should clearly identify which version of each figure or table is approved for publication.
How Technology Can Improve Visual and Tabular Quality Control
Digital publishing workflows can use automation to make repetitive checks faster and more consistent.
Image-analysis tools may identify potential duplication or unusual similarities. Optical character recognition can help extract text from figures, while structured-data comparisons can highlight differences between tables and manuscript text. Automated validation can also identify missing captions, inconsistent numbering, or unsupported file formats.
However, these tools have limitations. Text extraction may misread symbols, image algorithms may flag legitimate similarities, and numerical comparisons cannot establish whether a scientific result is valid.
The most effective process combines automation with editorial review and specialist judgment. Technology identifies where attention may be needed; qualified professionals determine whether the content is correct and what action should follow.
Who Is Responsible for Figure and Table Quality?
Quality control is a shared responsibility, but the roles should be clearly defined.
Authors are responsible for submitting accurate content and explaining the methods used to generate or process the data. Editors assess whether the content meets the journal’s requirements and whether any concerns need scientific or ethical review. Production teams verify file quality, formatting, and consistency across publication formats. Quality-control specialists check that corrections have been incorporated correctly.
A clear handoff process reduces the chance that each team assumes another person has verified the same issue.
Conclusion
Scientific figures and tables deserve their own quality-control process because they carry essential information that cannot always be verified through ordinary proofreading.
Incorrect labels, inconsistent values, missing units, poor resolution, and formatting changes can undermine a paper’s clarity and reliability. A structured workflow that combines scientific consistency checks, technical validation, risk-based review, and final proof inspection can help prevent these problems from reaching readers.
For publishers, the goal is not simply to make figures look polished. It is to preserve the accuracy, context, and meaning of the research they communicate.
When scientific visuals are checked as carefully as the manuscript itself, publishers take an important step toward protecting research quality and reader trust.